
How to Read a Topographical Survey Map: Contours, Spot Levels and Coordinates
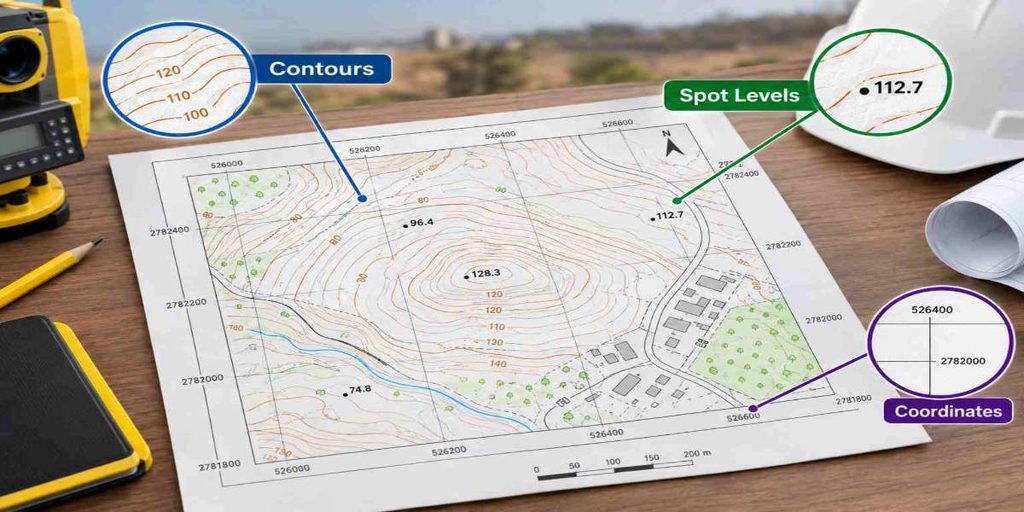
A topographical survey map shows the shape of the land, ground elevations, and existing features within a site. Engineers, architects, and contractors use this information to understand site conditions before preparing designs or starting construction.
Reading a topographical survey map involves more than looking at the lines and numbers on a drawing. Contour lines indicate changes in ground elevation, spot levels show elevations at specific points, and coordinate values identify locations on the site. Understanding these details helps project teams work with accurate ground information.
What Is a Topographical Survey Map?
A topographical survey map is a drawing prepared from field measurements that represents the existing ground surface and relevant site features. Depending on the project requirements, it may show roads, buildings, boundary features, utility structures, trees, drainage elements, and changes in ground level.
Surveyors collect this information using equipment such as total stations, GNSS receivers, and, where suitable, drone surveying systems. The measured data is then processed into a drawing that engineers can use for site planning and design.
How to Read a Topographic Survey Map
When reviewing a topographical survey map, start with the drawing legend, scale, coordinate information, and elevation reference. These details explain how the measurements are represented and how the drawing relates to the actual site.
Next, identify the existing features and examine the contour lines, spot levels, and coordinate points. Together, these elements help explain the site’s layout, ground shape, and elevation differences.
1. Understanding Contour Lines in Surveying
Contour lines connect points that have the same elevation. They are used to represent changes in ground height across a surveyed area.
The vertical difference between two consecutive contour lines is called the contour interval. For example, if a drawing uses a 0.5-metre contour interval, each adjacent contour represents a change of 0.5 metres in elevation.
Contour spacing helps indicate the shape of the land:
- Closely spaced contours generally indicate a steep slope.
- Widely spaced contours generally indicate a gentle slope.
- Contours forming closed loops may indicate a hill or depression, depending on the elevation values.
- Irregular contour patterns may represent uneven terrain or changes in the ground surface.
The contour interval should always be checked in the drawing legend. It can vary according to the terrain, survey requirements, and intended design use.
2. Reading Spot Levels in Topographical Surveys
Spot levels show the elevation of the ground at specific measured points. They are usually represented by numerical values beside survey points or symbols on the drawing.
For example, a spot level of 12.450 indicates an elevation of 12.450 metres when the drawing uses metres. The reference datum must be checked before interpreting the value.
Spot levels are useful when engineers need exact elevation information at particular locations. They can show levels along road edges, building entrances, paved areas, drainage points, and other important features.
Unlike contour lines, which represent a continuous pattern of equal elevations, spot levels provide values for individual measured positions. Both are important when reviewing the existing ground surface.
3. Understanding Coordinates on a Topographical Survey Map
Coordinates identify the horizontal position of surveyed points. Depending on the project, the drawing may use an approved local grid or a recognised coordinate reference system.
Easting and northing values are commonly used to define a point’s position on the site. Elevation may be recorded separately as a level or included as a third coordinate in an XYZ dataset.
When checking coordinates, pay attention to:
- The coordinate reference system and units.
- The relationship between the drawing and the site control points.
- The elevation datum used for level measurements.
- Whether the coordinates match the project survey requirements.
Incorrect assumptions about coordinate systems or datums can lead to positioning and level discrepancies during design and construction. Survey information should therefore be checked against the project’s approved control data.
What Are Topographic Survey CAD Drawings?
Topographic survey CAD drawings present surveyed features in a digital format that engineers and designers can use in their design software. They commonly include points, contours, spot levels, feature lines, and relevant site details.
Depending on the scope of work, deliverables may include DWG or DXF files, PDF drawings, coordinate lists, and digital terrain models.
CAD drawings allow project teams to compare the existing site with proposed designs. For example, a civil engineer can use the surveyed ground levels to develop grading plans, while an architect can review the relationship between the site and a proposed building layout.
The drawing should clearly identify its units, coordinate reference, elevation datum, and relevant symbols so that the information can be interpreted correctly.
How to Interpret Slope Gradients on a Survey Drawing
Slope gradients describe how much the ground rises or falls over a horizontal distance. They are important for understanding site access, surface drainage, road design, and earthworks.
A slope can be expressed as a percentage using the difference in elevation divided by the horizontal distance, multiplied by 100.
For example, if the ground rises by 1 metre over a horizontal distance of 20 metres, the slope is 5%.
Contour spacing can help identify areas where slopes change, while spot levels provide specific elevation values for checking the difference in height. However, contour spacing alone does not provide an exact gradient unless the contour interval and horizontal distance are known.
Engineers use this information alongside project requirements to assess grading, access routes, and drainage arrangements.
How Topographic Survey Data Is Processed
Topographic survey data processing converts field measurements into a drawing and other usable survey outputs. The exact workflow depends on the survey method, project size, and required deliverables.
The process generally includes the following steps:
- Field data collection: Surveyors measure ground points and record existing site features.
- Data checking: Measurements are reviewed for missing information, inconsistencies, and possible errors.
- Coordinate processing: Survey points are calculated or checked against the required coordinate system and control points.
- Surface modelling: Suitable elevation points and breaklines are used to represent the ground surface.
- Contour generation: Contours are generated from the surface model where required.
- Drawing preparation: Surveyed features, spot levels, contours, symbols, and annotations are organised into CAD drawings.
- Quality review: The final data and drawings are checked against the project scope and required accuracy.
The quality of the final drawing depends on the field measurements, point distribution, surface modelling method, and checks carried out during processing. A well-presented drawing is useful only when its underlying survey data is suitable for the intended purpose.
Common Symbols and Abbreviations on a Topographical Survey Map
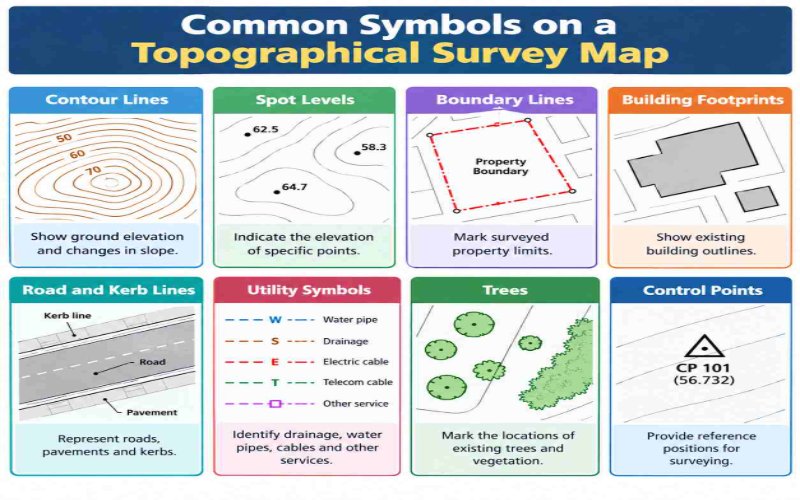
A topographical survey map uses symbols and abbreviations to show ground levels, property boundaries, buildings, roads and utilities. Understanding these markings helps surveyors, engineers and contractors interpret site conditions for design and construction.
- Common Symbols on a Topographical Survey Map
2. Common Abbreviations
| Abbreviation | Meaning |
| RL | Reduced Level |
| GL | Ground Level |
| FFL | Finished Floor Level |
| CL | Centre Line |
| BM | Benchmark |
| TBM | Temporary Benchmark |
| CP | Control Point |
| MH | Manhole |
| INV | Invert Level |
| TOC | Top of Curb |
| EOP | Edge of Pavement |
Note: Abbreviations may vary depending on the drawing standards and project requirements.
3. Why Are These Symbols Important?
These symbols help project teams understand site elevations, boundaries, existing structures and utilities. They support site grading, drainage design, construction planning and accurate setting out.
Always check the map legend to confirm the meaning of symbols and abbreviations before using the survey drawing for design or construction.
How to Check a Topographical Survey Map Before Using It
Before using a topographical survey map for engineering or construction work, review the drawing to confirm that it contains the information required for the project. Start by checking the survey date, drawing scale, units, coordinate reference system, and elevation datum.
Next, review the contour intervals, spot levels, and surveyed site features. Check whether important areas, such as access roads, drainage points, boundaries, and proposed building locations, are represented where required by the survey scope.
It is also useful to confirm that the supplied CAD files and PDF drawings contain consistent information. If ground levels appear inconsistent or important features are missing, raise the issue with the survey team before proceeding with design work.
These checks help project teams identify potential gaps early and make better use of the surveyed information during planning, design, and construction.
Why Topographical Survey Information Matters in Construction
A topographical survey provides the existing ground information needed to make design decisions. Without a clear understanding of the site levels and features, proposed designs may not reflect the actual conditions on the ground.
Architects use survey drawings to understand site constraints and building levels. Civil engineers refer to contours and spot levels when developing grading and drainage designs. Contractors may use the information to plan earthworks and compare existing conditions with proposed levels.
The survey also provides a reference for identifying differences between the surveyed site and the proposed design. Any discrepancies should be reviewed before construction decisions are made.
Conclusion
Reading a topographical survey map becomes easier when you understand the information represented by contour lines, spot levels, coordinates, slope gradients, and drawing symbols. Each element provides a different part of the picture: contours show the land’s shape, spot levels give specific elevations, and coordinates identify measured positions.
For construction and engineering projects, these details help teams understand existing site conditions and prepare designs based on surveyed information. The drawing legend, coordinate system, elevation datum, and stated survey scope should always be checked before using the data for design or site work.
Topographical Survey Services in Dubai
Northern Engineering Surveys L.L.C. provides surveying services for construction, engineering, and infrastructure projects. Topographical survey information helps project teams understand existing ground levels, site features, and terrain conditions before design and construction activities begin.
Visit NES Dubai to learn more about its surveying services.
FAQs
1. What does a topographical survey map show?
A topographical survey map shows existing ground levels, contour lines, spot elevations, coordinates, and natural or man-made features within a surveyed area.
2. How do you read contour lines on a topographical survey map?
Contour lines connect points with the same elevation. Lines that are close together generally indicate steep ground, while lines spaced farther apart usually indicate a gentler slope.
3. What is a contour interval in surveying?
A contour interval is the vertical elevation difference between two consecutive contour lines. For example, a 0.5-metre contour interval means adjacent contours represent a height difference of 0.5 metres.
4. What are spot levels in a topographical survey?
Spot levels are numerical values showing the elevation of specific surveyed points. They help engineers identify ground heights at locations such as road edges, building entrances, and drainage points.
5. What coordinate system is used in a topographical survey?
A topographical survey may use an approved local grid or a recognised coordinate reference system. The correct system depends on the project requirements and should be identified in the survey drawing.
6. How are topographical survey CAD drawings used in construction?
Topographical survey CAD drawings provide existing site information that architects, engineers, and contractors use for site planning, grading, drainage design, and comparison with proposed layouts.
7. How is slope gradient calculated from survey levels?
Slope gradient is calculated by dividing the vertical elevation difference by the horizontal distance and multiplying by 100 to obtain a percentage. For example, a 1-metre rise over 20 metres gives a 5% slope.
8. Why is a topographical survey important before construction?
A topographical survey helps project teams understand existing ground conditions, identify elevation changes, plan drainage and grading, and prepare designs that account for the actual site layout.